Understanding ElasticSearch Performance
Nov 26, 2015 · 4 min
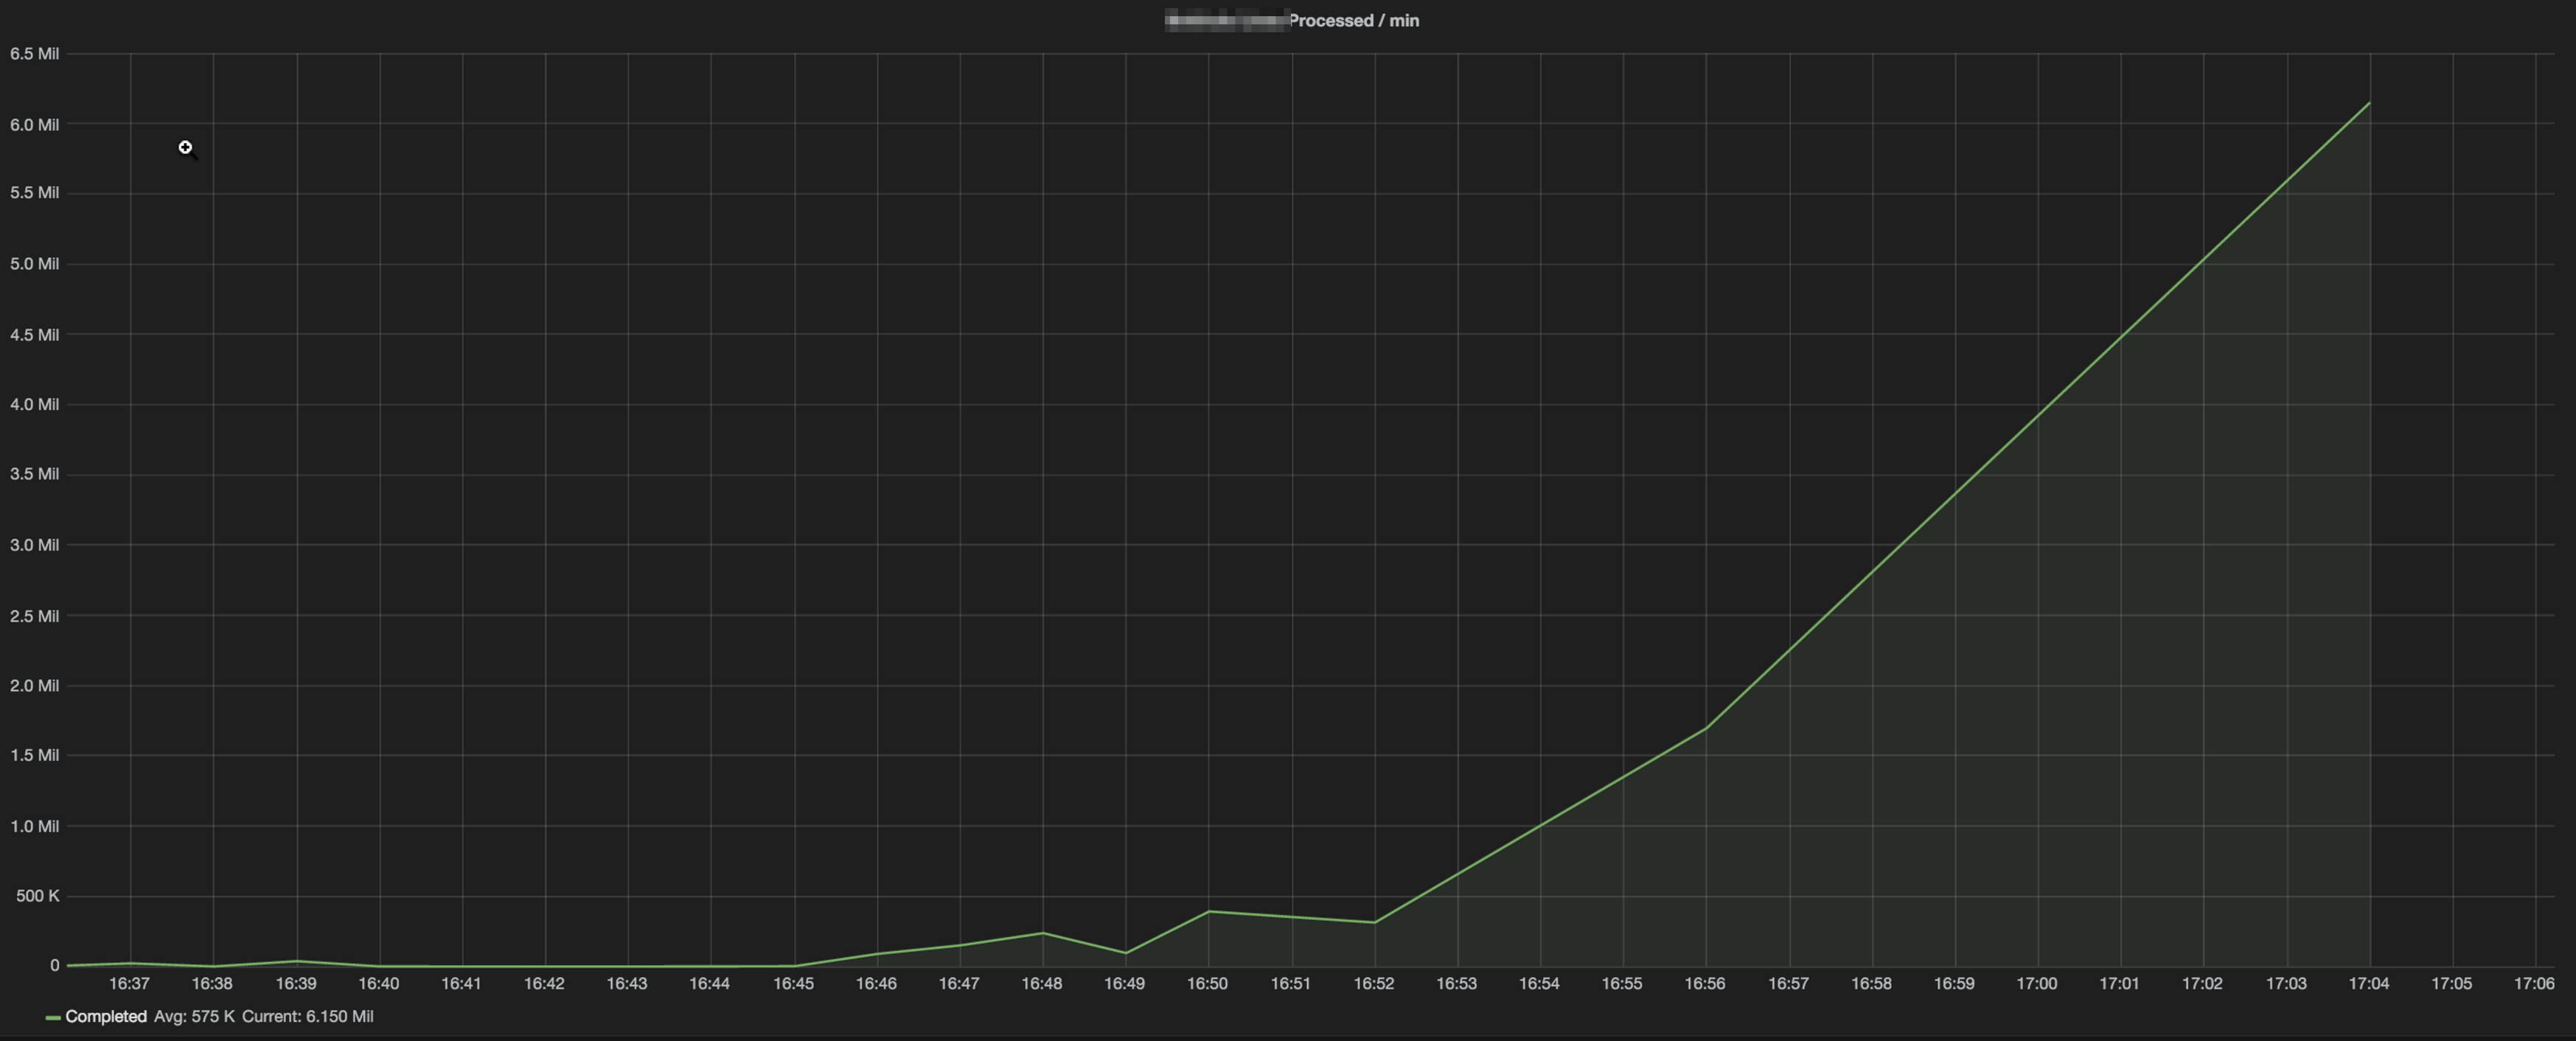
Performance before and after Optimizations
When working with billions of documents in your Elasticsearch cluster, there are a few important things to keep in mind:
- Look at what the big players do (Elasticsearch/Kibana) for organization and planning
- Experiment with index sizes that make sense for your business, don’t just assume 1 index for a billion documents is a good idea (even if you N shards)
- Understand which metrics to monitor when you are performance testing your cluster
- Monitor all points of ingestion: Elasticsearch, Load balancers (ELB, HAProxy, etc), and your application code that is inserting
What do the big players do?
Split by date ranges. Based on your data, decide whether daily, weekly, or even monthly splits are best for your dataset. Elasticsearch reccomends not going over 30-32G per shard based on current JVM memory reccomendations . The reason they reccomend to stay below 32G of ram per shard is that after that, the JVM will use uncompressed pointers which means internal pointers go from 4 bytes to 8 bytes, which (depending on your memory size) can lead to decreased heap available and also increased GC times from the JVM.
Don’t allocate more than 50% of your system memory for the JVM. Your kernel will cache files and help keep performance up. Over-allocating the JVM can lead to poor performance from the underlying engine, Lucene, which relies on the OS cache as well as the JVM to do searches.
Understand your users: other devs, other systems, etc. Don’t do deep pagination instead, use scan and scroll . Turn on slow logging to find any queries doing this or returning to many points of data per query.
Index Sizing and Memory
Keeping in mind the 30-32G per shard reccomendation, this will determine the number of shards per dataset. Remember shards are not modifiable but replicas are. Shards will increase indexing performance, while replicas will increase search performance.
Overwhelmed and can’t figure out what to do? Just start with an index and see how things go. Using alias’s you can create another index later on and map both of them together for searching (and eventually delete the old one if the data expires). If you start out with alias’s being used, transitions can be seemless (no need to redeploy to point to the new alias/index name).
Metrics to monitor
Use the plugin community to monitor your cluster: ElasticHQ , BigDesk , Head and Paramedic .
Watch for refresh/merge/flush time (ElasticHQ makes this available under Node Diagnostics). For example, with a large index (1TB) that has frequent updates or deletions, in order for the data to actually be freed from the disk and cluster fully, a merge must be performed. When the number of segments in a cluster gets to large, this can cause issues for refreshing and merging.
The basic idea is the larger your index, the more segments, and the more optimization steps that need to be performed. Automatic flushes happen every few seconds so more segments get created - as you can imagine this gets compounded the larger your index is. You can see a full rundown of how deleting and updating works in the documentation .
By seperating our indexes into smaller datasets (by day, week, or month) we can eliminate some of the issues that pop up. For example, a large number of segments can cause search performance issues until an optmize command is run (which in itself can cause high IO and make your search unavailable). By reducing the data we reduce the time these operations can take. We also end up at a point where no new data is inserted into the old indexes, so no further optimizations need to be done on them, only new indexes. Any acitivity on the old indexes then should only be from searching and will reduce the IO requirements from the cluster for those shards/indexes.
This also greatly simplifies purging old data. Instead of having to have the cluster do merges and optimizations when we remove old documents, we can just delete the old indexes and remove them from the aliases. This will also reduce the IO overhead on your cluster.
Monitoring Ingestion
Watch your ELB response time - is it spiking? Check flush, merge, and indexing times.
Add logging to your posts to understand how long each bulk insert is taking. Play with bulk sizes to see what works best for your document/datasize.
When moving from a single large index to aliased indexes, insertion times went from 500ms-1.5s+ to 50ms on average. Our daily processes that were taking half a day to complete, finishing in less than 15 minutes.
Processing 5k log lines per minute? Now we’re processing over 6 million.
Taking the time to understand your database and how each part of it works can be worth the effort especially if you’re looking for performance gains.