Affordable logging for kubernetes hobby projects
Oct 13, 2021 - 3 minutesHaving a useable logging and metrics stack for your hobby projects can be extremely expensive if you stick them inside your kubernetes cluster or try and host them on a normal VPS provider (whether that means DigitalOcean or AWS).
Below is an example configuration I use for some hobby projects that uses a dedicated hosting provider (OVH).
This solves two main problems for me: hosting it securely (not exposing anything other than SSH) and having a beefy enough box to run elastic search and apm.
This is a small setup script that locks down the logging server to only allow SSH and installs the ELK stack,
On the logging server:
 1wget -qO - https://artifacts.elastic.co/GPG-KEY-elasticsearch | sudo apt-key add -
 2sudo apt-get install apt-transport-https
 3echo "deb https://artifacts.elastic.co/packages/7.x/apt stable main" | sudo tee /etc/apt/sources.list.d/elastic-7.x.list
 4sudo apt-get update && sudo apt-get install elasticsearch kibana
 5vi /etc/elasticsearch/jvm.options
 6service elasticsearch start
 7ufw default deny incoming
 8ufw default allow outgoing
 9ufw allow ssh
10ufw enable
Next, we need to download and apply the filebeat and metric beat configs,
On the kubernetes cluster:
1curl -L -O https://raw.githubusercontent.com/elastic/beats/6.0/deploy/kubernetes/filebeat-kubernetes.yaml
2curl -L -O https://raw.githubusercontent.com/elastic/beats/7.10/deploy/kubernetes/metricbeat-kubernetes.yaml
3kubectl apply -f filebeat-kuberentes.yaml
4kubectl apply -f metricbeat-kubernetes.yaml
Then we’ll need to create a SSH key to get into the logging server. You can create the secret with a given ssh private key,
Locally:
1kubectl create secret generic logging-ssh-key --from-file=id_rsa=logging_ssh_key
Install the APM server,
On the kubernetes cluster:
1helm repo add elastic https://helm.elastic.co
2helm install apm-server --version 7.10 elastic/apm-server
Create the below as a yaml file manifest and apply it with kubectl apply -f filename.yaml.
- Setup a config map with a startup script that will port-forward 9200 over SSH to the logging server
- Deploy a service into the cluster to allow local services to talk to it
- Setup health checks and liveness probes to restart the pod if the SSH connection gets interrupted
- Mounts the SSH key for the pod to connect from a secret
 1# get ssh key from logging
 2apiVersion: v1
 3kind: ConfigMap
 4metadata:
 5  name: "logging-ssh-forwarder-script"
 6data:
 7  start.sh: |
 8    #!/bin/sh
 9    apk add --update openssh-client curl
10    mkdir ~/.ssh
11    ssh-keyscan -H logging.exmaple.com >> ~/.ssh/known_hosts
12    ssh -i /etc/ssh-key/id_rsa -N -o GatewayPorts=true -L 9200:0.0.0.0:9200 [email protected]
13---
14apiVersion: v1
15kind: Service
16metadata:
17  name: logging-forwarder
18spec:
19  selector:
20    run: logging-forwarder
21  ports:
22    - protocol: TCP
23      port: 9200
24---
25kind: Deployment
26apiVersion: apps/v1
27metadata:
28  name: filebeat-ssh-forwarder
29spec:
30  selector:
31    matchLabels:
32      run: logging-forwarder
33  replicas: 1
34  template:
35    metadata:
36      labels:
37        run: logging-forwarder
38    spec:
39      containers:
40        - name: forwarder
41          image: alpine:latest
42          command:
43            - "/start"
44          ports:
45            - containerPort: 9200
46          livenessProbe:
47            exec:
48              command:
49                - curl
50                - localhost:9200
51          readinessProbe:
52            exec:
53              command:
54                - curl
55                - localhost:9200
56          volumeMounts:
57            - name: ssh-key-volume
58              mountPath: "/etc/ssh-key"
59            - name: logging-ssh-forwarder-script
60              mountPath: /start
61              subPath: start.sh
62      volumes:
63        - name: logging-ssh-forwarder-script
64          configMap:
65            name: logging-ssh-forwarder-script
66            defaultMode: 0755
67        - name: ssh-key-volume
68          secret:
69            secretName: logging-ssh-key
70            defaultMode: 256
Lastly you’ll need to change the APM server to point to our new service,
On the kubernetes cluster:
1kubectl edit cm apm-server-apm-server-config
You can now connect to your ELK stack and view APM metrics and other logs flowing into your cluster:
1ssh -L 5601:127.0.0.1:5601 [email protected]
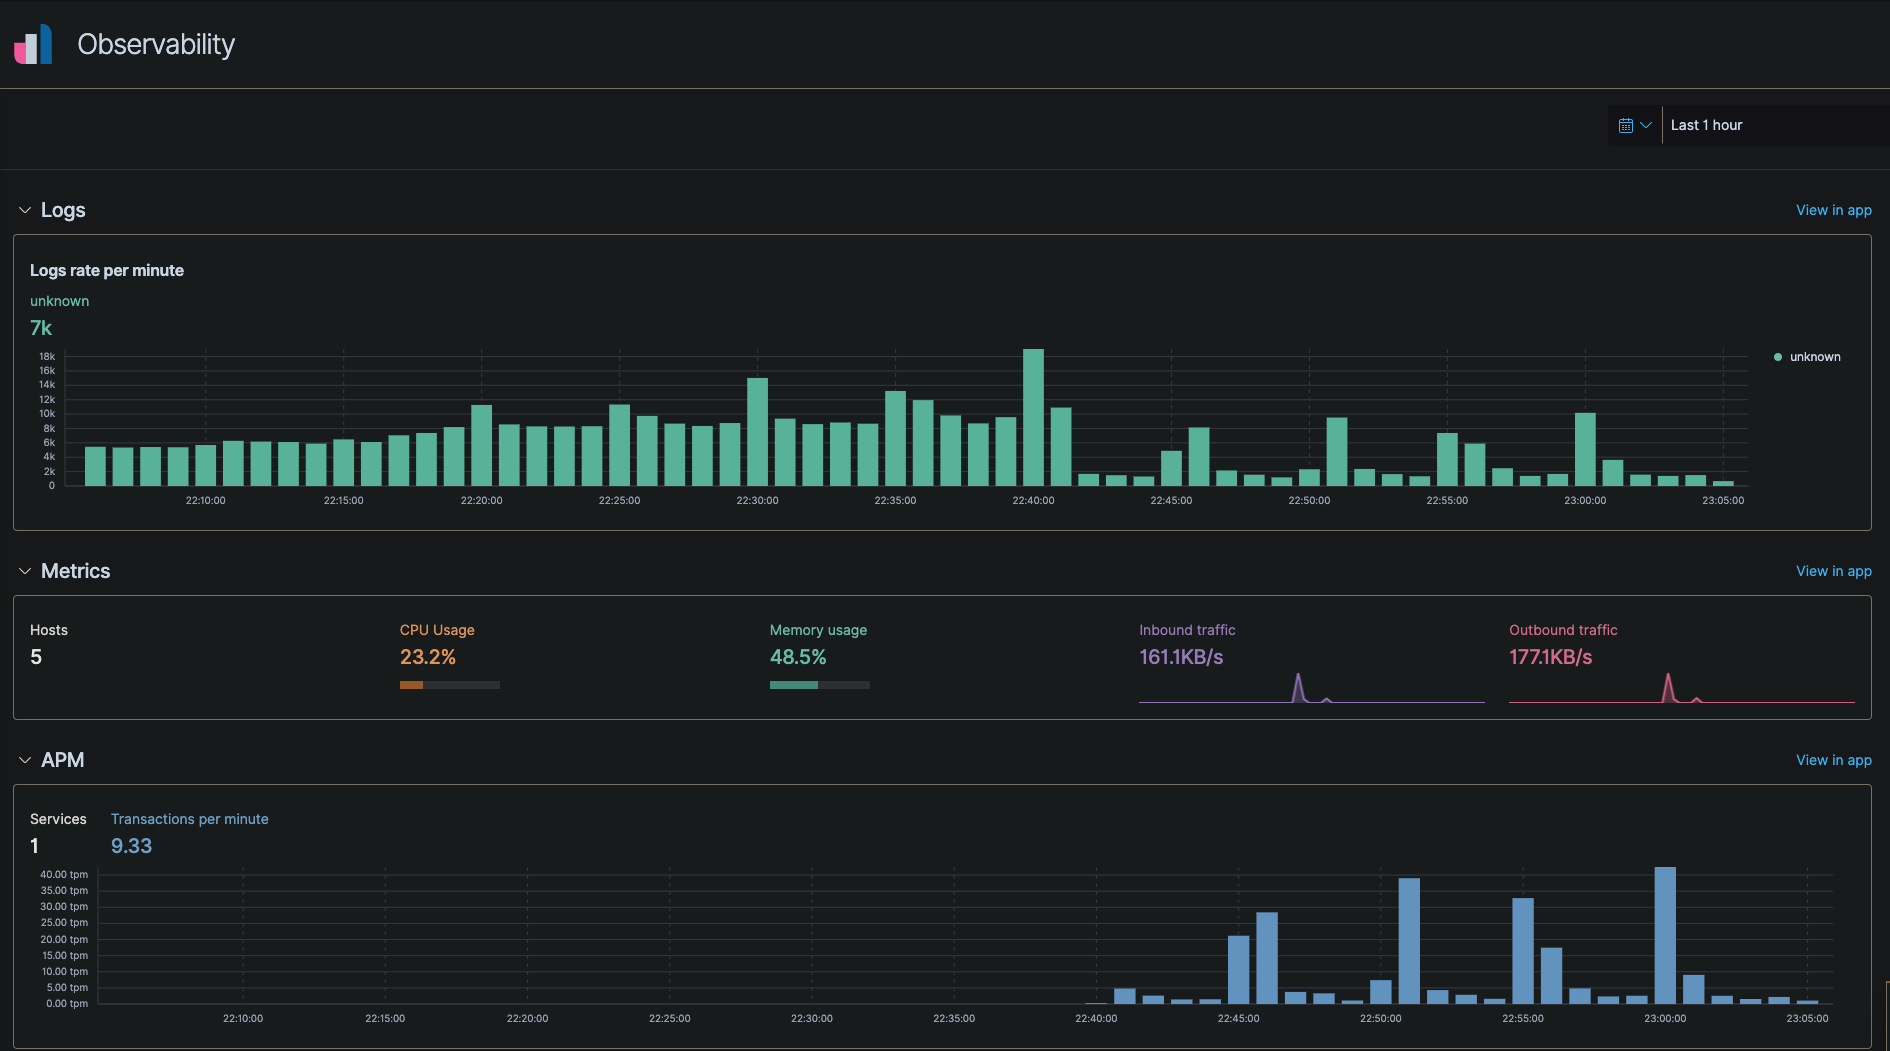
And open your browser to http://localhost:5601
Here is an example of the APM dashboard in Kibana under Observability -> Overview
And that’s it. Make sure you setup index policies to rotate large indexes so the disks don’t get full.
 GitHub